AMD uProf Usage Guide
AMD uProf is a performance analysis tool for AMD processors and GPUs. It provides insights into application performance, including CPU/GPU usage, memory behavior, and threading efficiency. This guide outlines how to use AMD uProf on RCAC clusters.
Loading on RCAC Clusters
AMD uProf is available on the gautschi cluster and can be loaded with:
You can verify installation and version with:
Collecting Performance Data
Similar to other profiling tools, AMD uProf operates in two stages: data collection and analysis. Profiling can be performed via the CLI and later visualized using the GUI or text-based reports.
Basic Syntax
To collect data on an application your_app, use:
This command collects data using the specified profile type and saves results in the output-dir directory.
Common Profile Types
tbp(Time-Based Profiling):- Collects periodic samples of function usage.
- Useful for identifying hotspots and frequently executing functions.
hotspots- Use this configuration to identify where programs are spending time and it's callstack.
overview- Use this configuration to get an overall analysis and to find potential issues for further investigation.
threading(Threading Analysis)- Use this configuration to get an overall threading analysis and to find potential issues for further investigation.
memory(Cache Analysis)- Use this configuration to identify the false cache-line sharing issues. The profile data will be collected using IBS OP.
Analyzing Performance Data
From the directory you specified during profiling, you are able to immediately create profiling summaries directly on the command line via the report option in uProf:
This will result in a summary CSV file detailing your run
uProf also offers a Graphical User Interface to analyze profiling runs directly, and can be launched with the AMDuProf command, which will lauch the GUI:
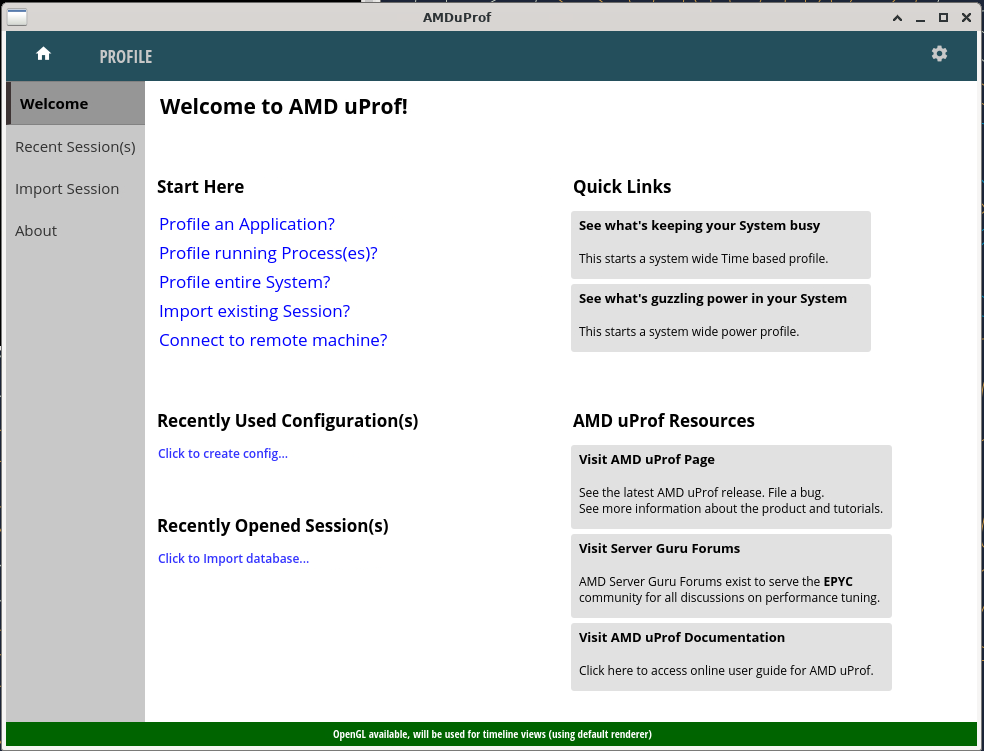
In the GUI, open your result directory by navigating to "Import Session", and open the /path/to/output-dir/AMDuProf...MMM-DD-YYYY_hh-mm-ss directory that was generated during your run
Example
In this simple program, we have introduced several inefficiencies that we may be able to detect through uProf profiling.
After we compile, we can collect a time based profiling run of this code with the following command:
This saves results to a ./uprof_results/AMDuProf-test-TBP_MMM-DD-YYYY_hh-mm-ss/ directory, which can be directly analyzed with either the AMDuProfCLI report option:
Alternatively, view results in the GUI via AMDuProf GUI
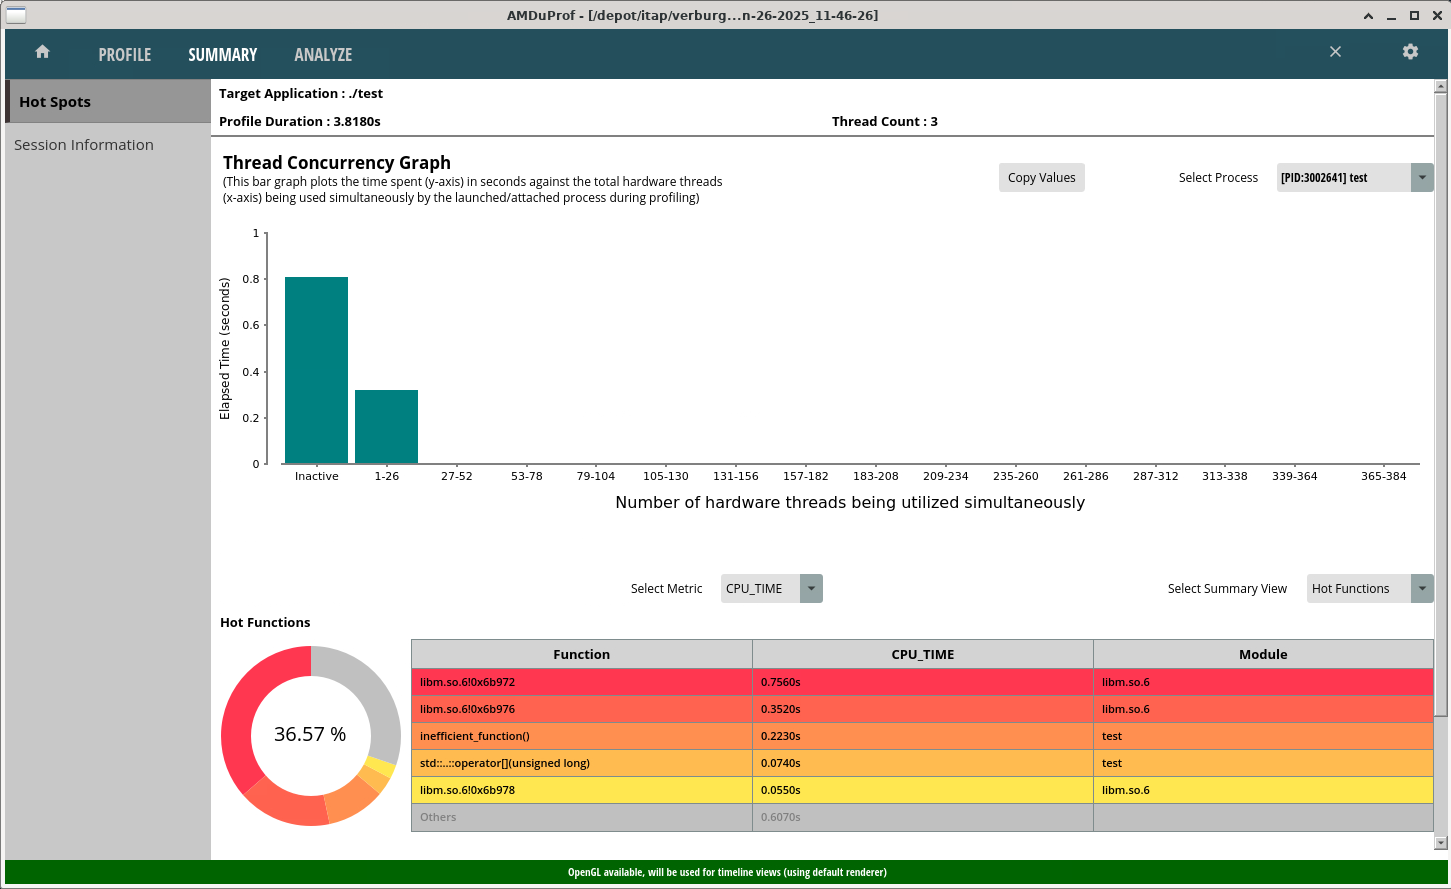
After loading the results in the GUI, you will be provided with an overview summary of the results, which provides a breakdown of where time is spent:
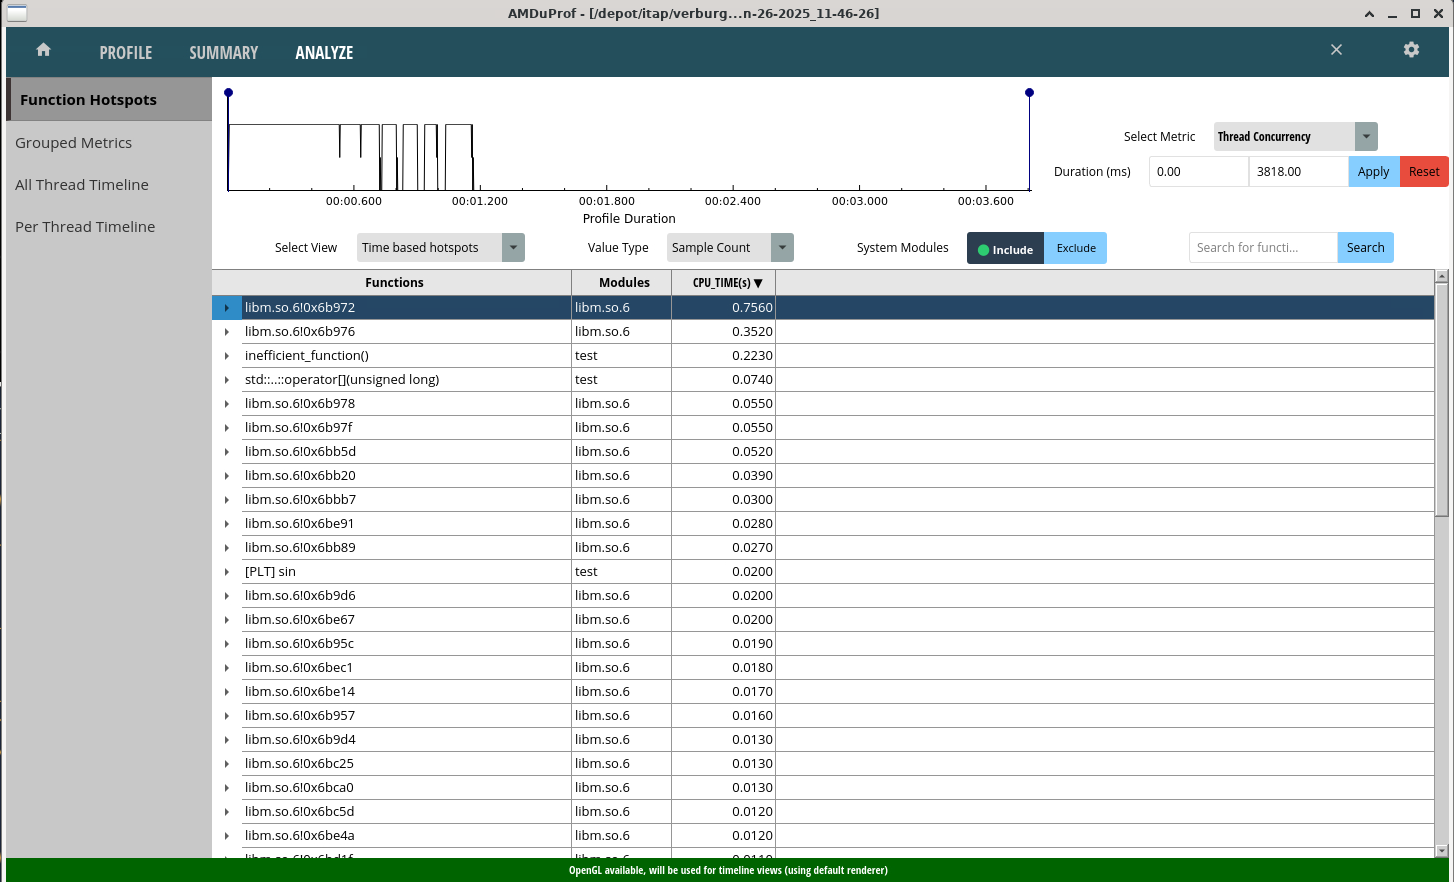
By navigating the the analysis tab, you will be able to see a timeline breakdown of the profiling run: