NVIDIA Nsight Systems
Overview
NVIDIA Nsight Systems is a powerful tool that enables tracing of any NVIDIA GPU-accelerated application. It generates a holistic, easy-to-understand, and visually pleasing timeline view of system metrics, including all available hardware resources and active processes. This helps developers find performance issues and identify optimization opportunities. Beyond performance investigations, Nsight Systems is an ideal debugging tool for asynchronous GPU computing. Nsight Systems is available as both a CLI and GUI application, useful to different user needs.
Quick Start Guide
-
Installation: Load the CUDA module on your system:
-
Basic Profiling: Profile your application using the CLI:
-
View Results: Either use the CLI to view stats:
Or launch the GUI for visual analysis:
For more detailed instructions, see the sections below.
Supported Platforms
Nsight Systems supports profiling on various platforms and can be used both locally—to profile code running on your machine—and remotely by connecting to targets over SSH or Bluetooth. For more details on which hosts can profile which targets, visit NVIDIA's website for additional information.
Installation
- If you have an NVIDIA GPU on your local system, you can install Nsight Systems by visiting this link. With your local installation, you can collect profiling data from GPU-accelerated applications running on your system or connect to other devices via Bluetooth (for devices like Jetson) or SSH to profile code on remote computers.
- On RCAC clusters with NVIDIA GPUs (Gautschi, Gilbreth, Anvil, and Scholar), Nsight Systems is typically installed alongside CUDA in the same binary directory. Loading the CUDA module will automatically set the paths for both the CLI tool (
nsys) and the UI tool (nsys-ui) in your environment.
For example, on Gilbreth:
In some cases, the tool may also exist separately within the CUDA directory. For example, we have another installation of Nsight Systems in the CUDA directory:
Profiling and Analysis
NVIDIA Nsight System CLI (nsys)
First, ensure you have been allocated access to GPUs via the nvidia-smi command.
Provided you have access to GPUs, you can profile a GPU-enabled application from the command line using the nsys command:
Common options:
--gpu-metrics-device=all– Collects GPU performance metrics (only works for Turing and newer architectures)--trace=cuda,nvtx,osrt– Specify tracing for CUDA, NVTX, and OS runtime
For example, we can track GPU usage in machine learning training with:
This will create two files, my_profile.sqlite and my_profile.qdrep (or my_profile.nsys-rep depending on the version) which store the results of the profiling. To analyze results directly on the command line, you can then run the following command:
This command will output several tables that may be of interest for GPU optimization. For the purposes of GPU benchmarking, the CUDA API summary table will contain the statistics for the runtimes of CUDA API functions:
If your program is frequently transferring a large amount of data to and from the GPU (for example, loading batches of training data), it may be useful to inspect the "host to device" and "device to host" memory copy times:
- An
nsysreport is a database of collected samples and derived metrics. Using thensysCLI, you can export the report into various formats, including SQLite, JSON, and more. - For more profiling options visit NVIDIA Nsight documentation.
Limitations in Profiling
For security reasons, some profiling options and results are not available for public use. Particularly, anything that utilizes performance counters on GPUs, or performs CPU sampling, are disabled. This means that capture options utilizing performance counters, or that otherwise require root access, will not be operational for general users. These options include:
--gpu-metrics-device=XXX--gpu-metrics-set=XXX--sample=system-wide--event-sample=system-wide--cpu-core-events=XXX--cpu-core-metrics=XXX--cpuctxsw=system-wide--run-as=XXX--ftrace=XXX
NVIDIA Nsight System GUI (nsys-ui)
If you'd prefer to analyze via a graphical interface, you can use nsys-ui both to load the profiling results and to profile.
Launching GUI
RCAC Clusters' nsys-ui App Launcher
In some of our clusters, we have an app-launcher for this tool:
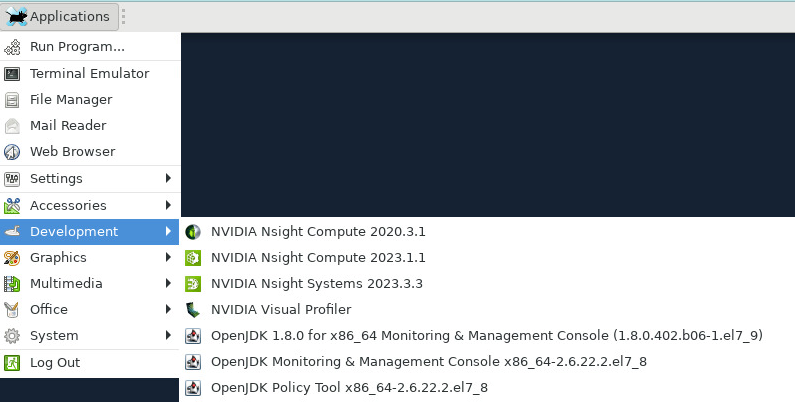
If the system provides an app launcher for nsys-ui, you can simply open it through the graphical interface without manually loading modules. Search for Nsight Systems UI in the application menu.
Launching Without an App Launcher
If an app launcher is unavailable, you may need to manually load the required modules before running nsys-ui.
-
Prerequisite Modules:
Profiling
- Load the modules and launch Nsight Systems UI
nsys-ui. - Specify the Profiling Target, which is the system where your CUDA application will run.
- You have the option to choose a remote machine with SSH and USB connection options. However, since this tutorial is focused on profiling applications running on the RCAC cluster, you need to connect to the Localhost, as it is already one of the RCAC nodes.
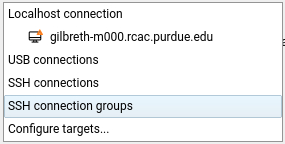
- Connect to the target machine.
- Set up profiling configuration:
- Command Line with Arguments: Provide the path to the executable file. This is the only mandatory setting.
- Working Directory: Automatically set but can be changed if needed.
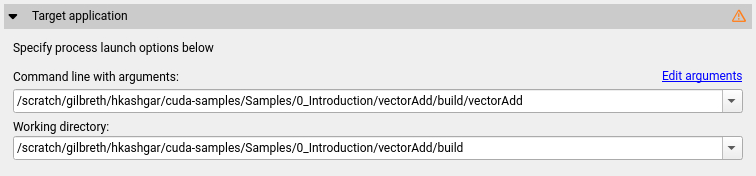
- Data Collection Settings:
- Note: Choosing too many metrics can introduce overhead, so enable only necessary ones. Consider tracing different events across multiple runs to minimize overhead.
- There are plenty of customization options, and you will need to enable only a small subset of collection metrics.
- An explanation of each option is available in the Nsight Systems documentation.
- Click Start to begin data collection.
- Then, it will create a Nsight Systems report after executing the application and display the collected metrics inside the GUI.
Loading Profiling results
- Load dependent graphical utilities:
module load xcb-util-cursor xcb-util-image xcb-util-keysyms xcb-util-renderutil xcb-util-wm, and launch the Graphical interface withnsys-ui(Or use the app launcher described above). - Open the
.nsys-repor.qdrepwith File > Open. - A timeline of the processes will load. The X axis represents the runtime, and the Y axis has a breakdown of each process. Within each process, you can view the memory copy and CUDA API events.
- You can highlight a portion of the timeline and right-click to zoom to selection.
- Right-clicking any row on the Y axis and clicking "show in events view" will provide a summary in the bottom of the window.
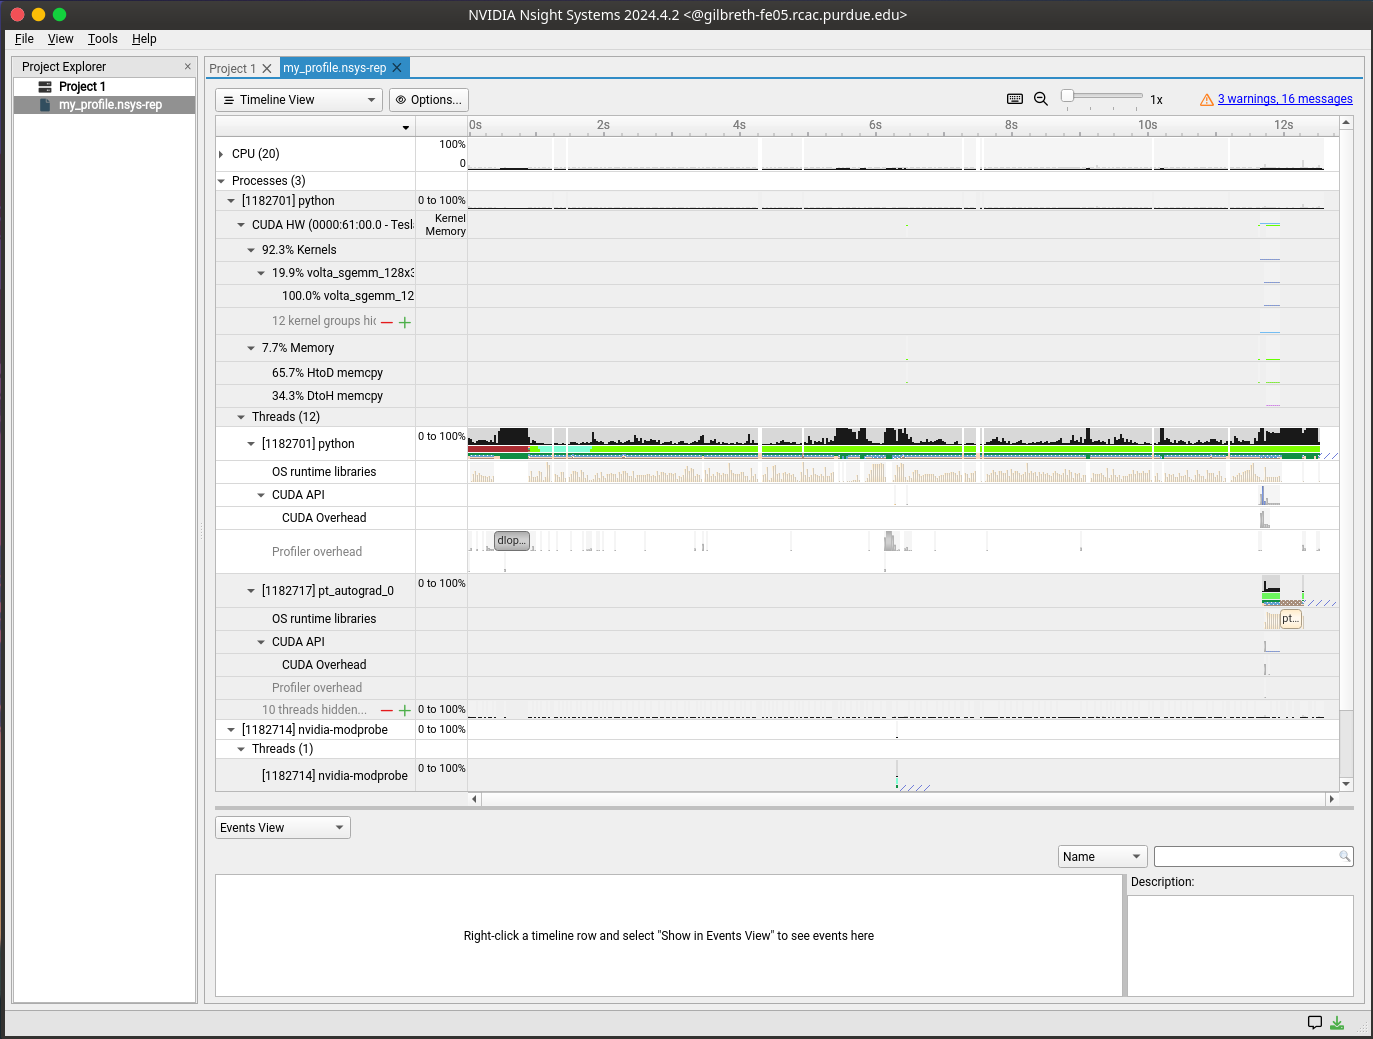
Interpreting Results
Understanding Timeline View
- CPU Rows: Show thread activity, API calls, and synchronization points
- GPU Rows: Display kernel executions, memory transfers, and hardware metrics
- Memory Rows: Indicate memory operations between host and device
- CUDA API Rows: Show CUDA API calls and their duration
Common Performance Patterns
- GPU Idle Periods
- Look for gaps in GPU timeline
- Check for CPU bottlenecks or synchronization issues
- Consider using CUDA streams for better overlap
- Memory Transfer Bottlenecks
- Large host-to-device or device-to-host transfers
- Consider using pinned memory or unified memory
- Look for opportunities to reduce data movement
- API Call Overhead
- Frequent small kernel launches
- Consider kernel fusion or batching
- Look for unnecessary synchronization points
Troubleshooting
Common Issues
- Unable to Launch nsys-ui
- Ensure all required modules are loaded
- Check X11 forwarding if running remotely
- Verify GPU driver compatibility
- Profile Collection Fails
- Verify GPU allocation and access
- Check available disk space
- Ensure proper permissions
- High Overhead During Profiling
- Reduce the number of metrics collected
- Use shorter collection duration
- Apply appropriate filters
Error Messages
- "No CUDA application was profiled": Ensure your application is using CUDA and GPU resources are available
- "Failed to load driver": Check CUDA installation and driver compatibility
- "Unable to connect to target": Verify SSH settings and network connectivity for remote profiling
FAQs
- Where are the logs stored?
-
By default,
nsysgenerates.qdrep(or.nsys-rep) and.sqlitefiles, which store data in a format that thensys-uiapplication can easily understand. If you'd like to export the data in a friendlier CSV format, you can use the following:
-
For more details on using Nsight Systems, please check the NVIDIA Nsight Systems documentation and the User Guide.